







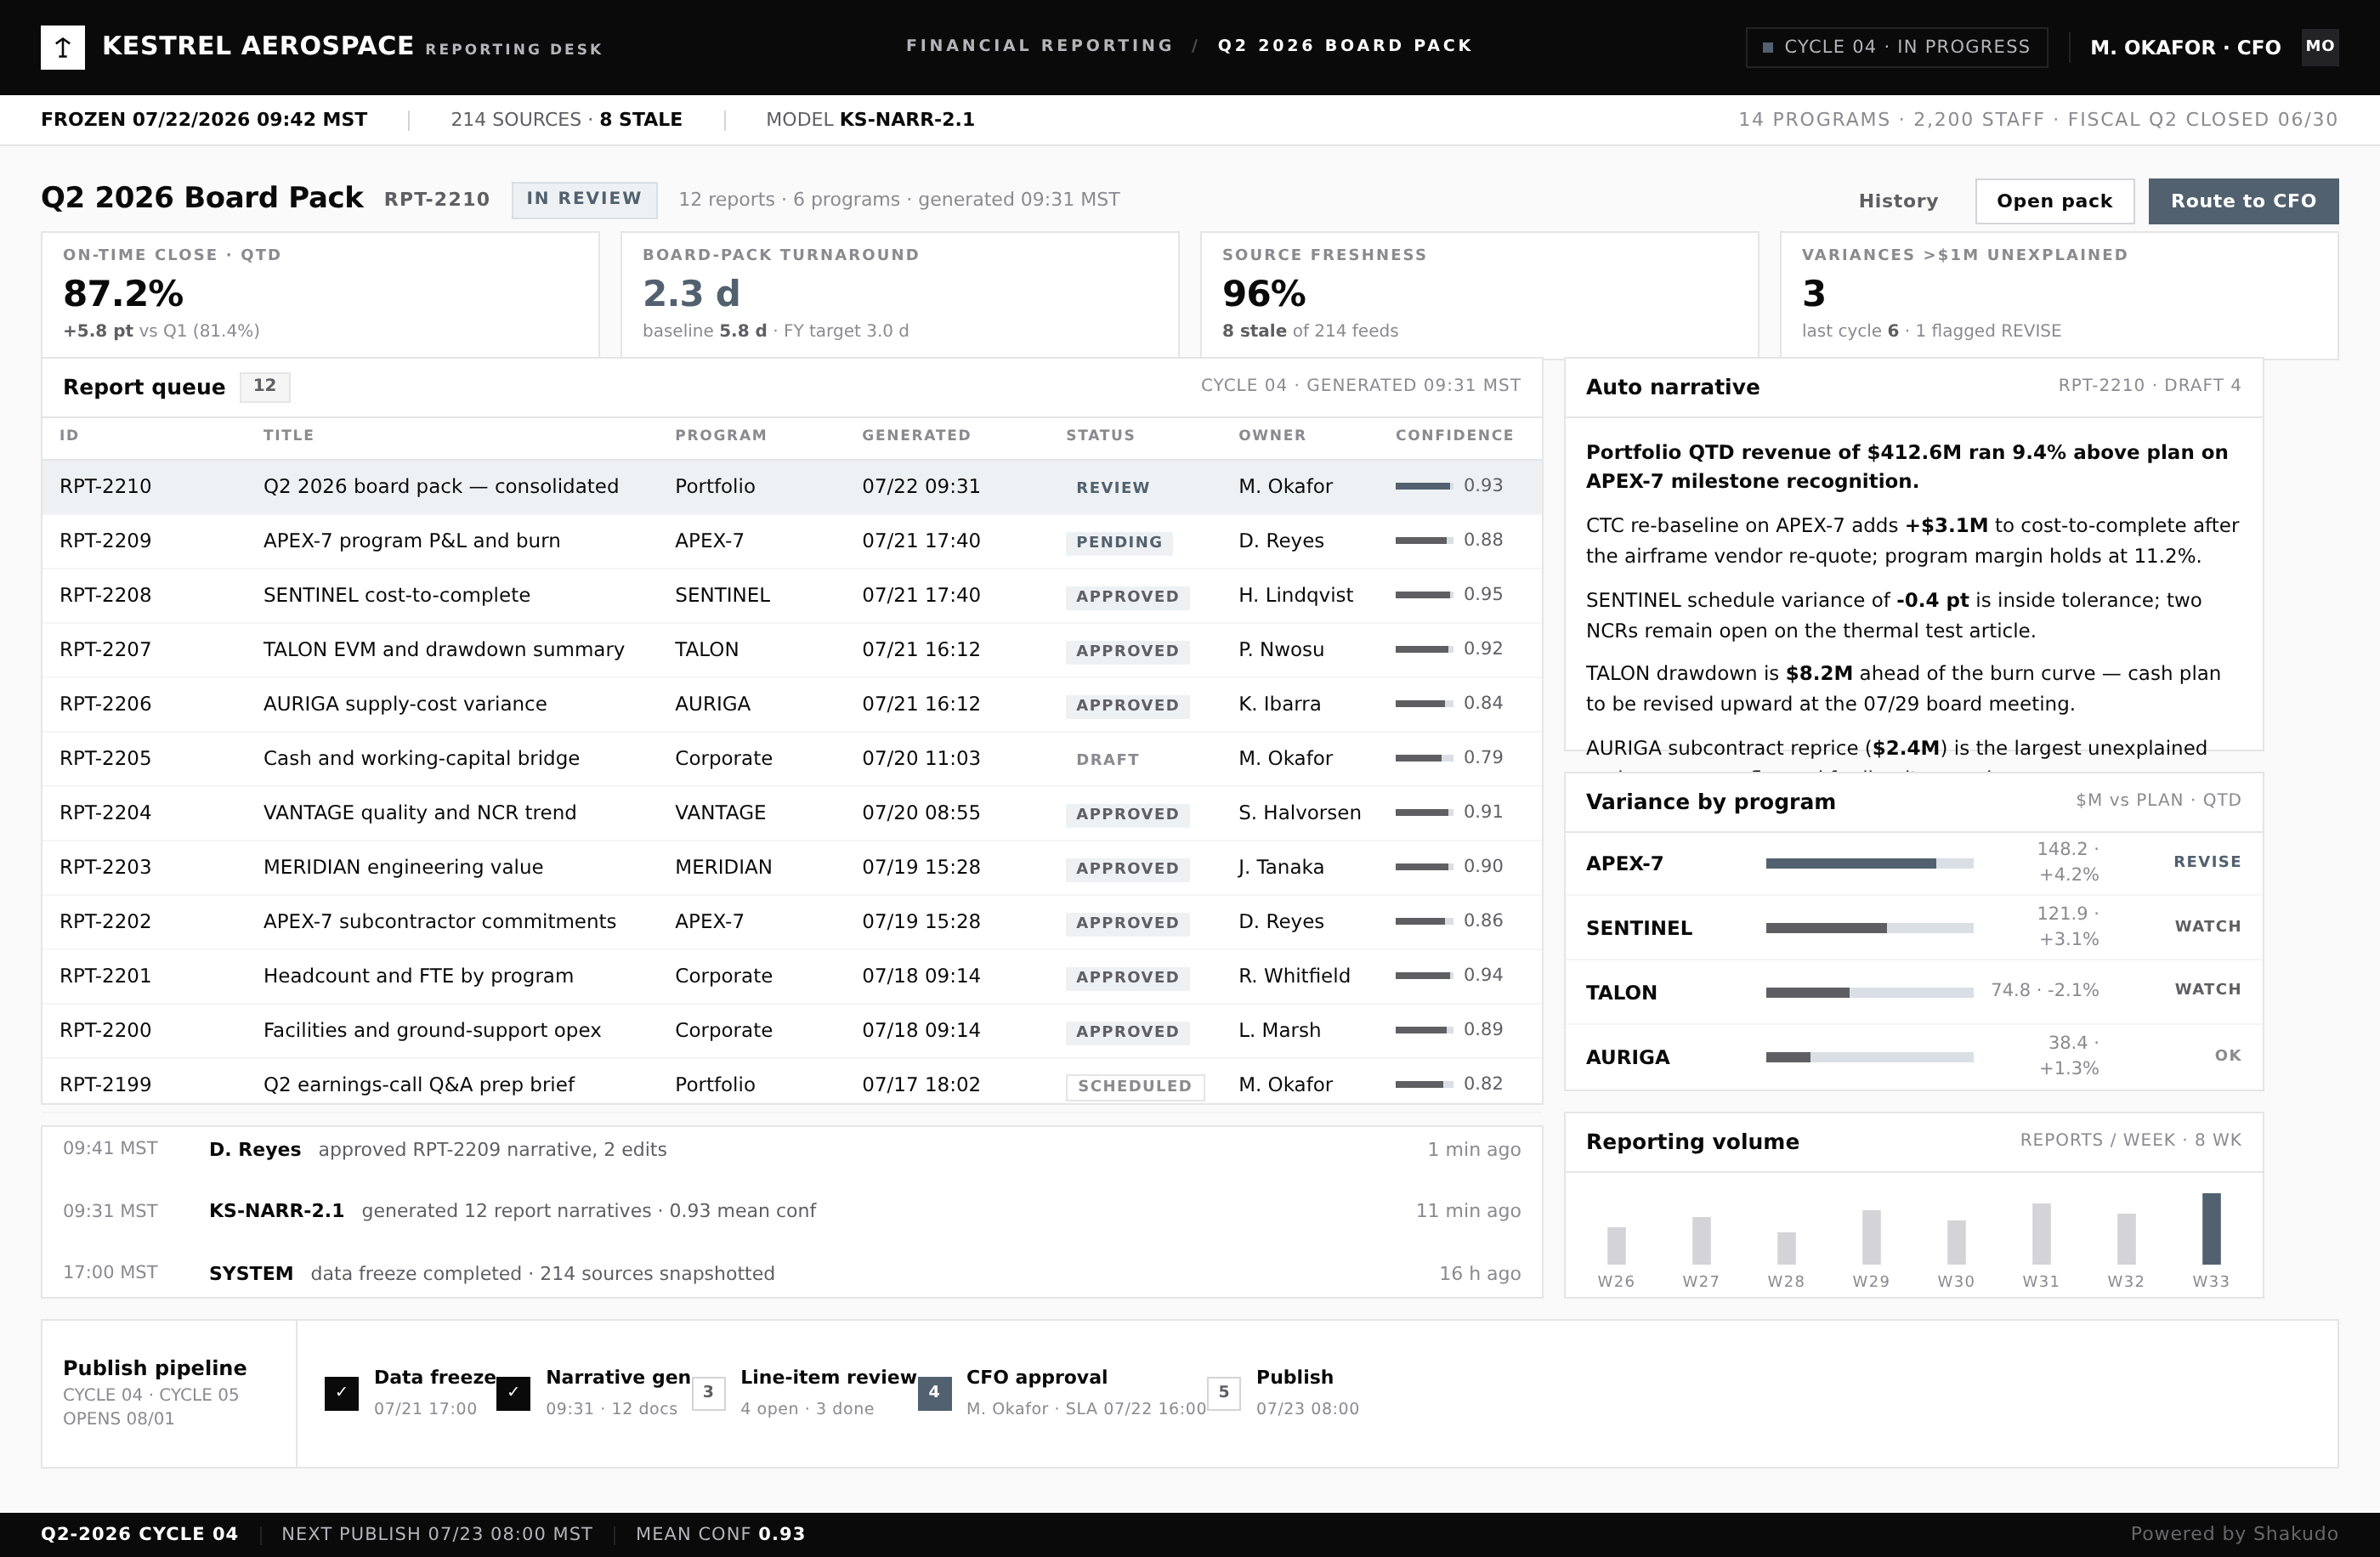
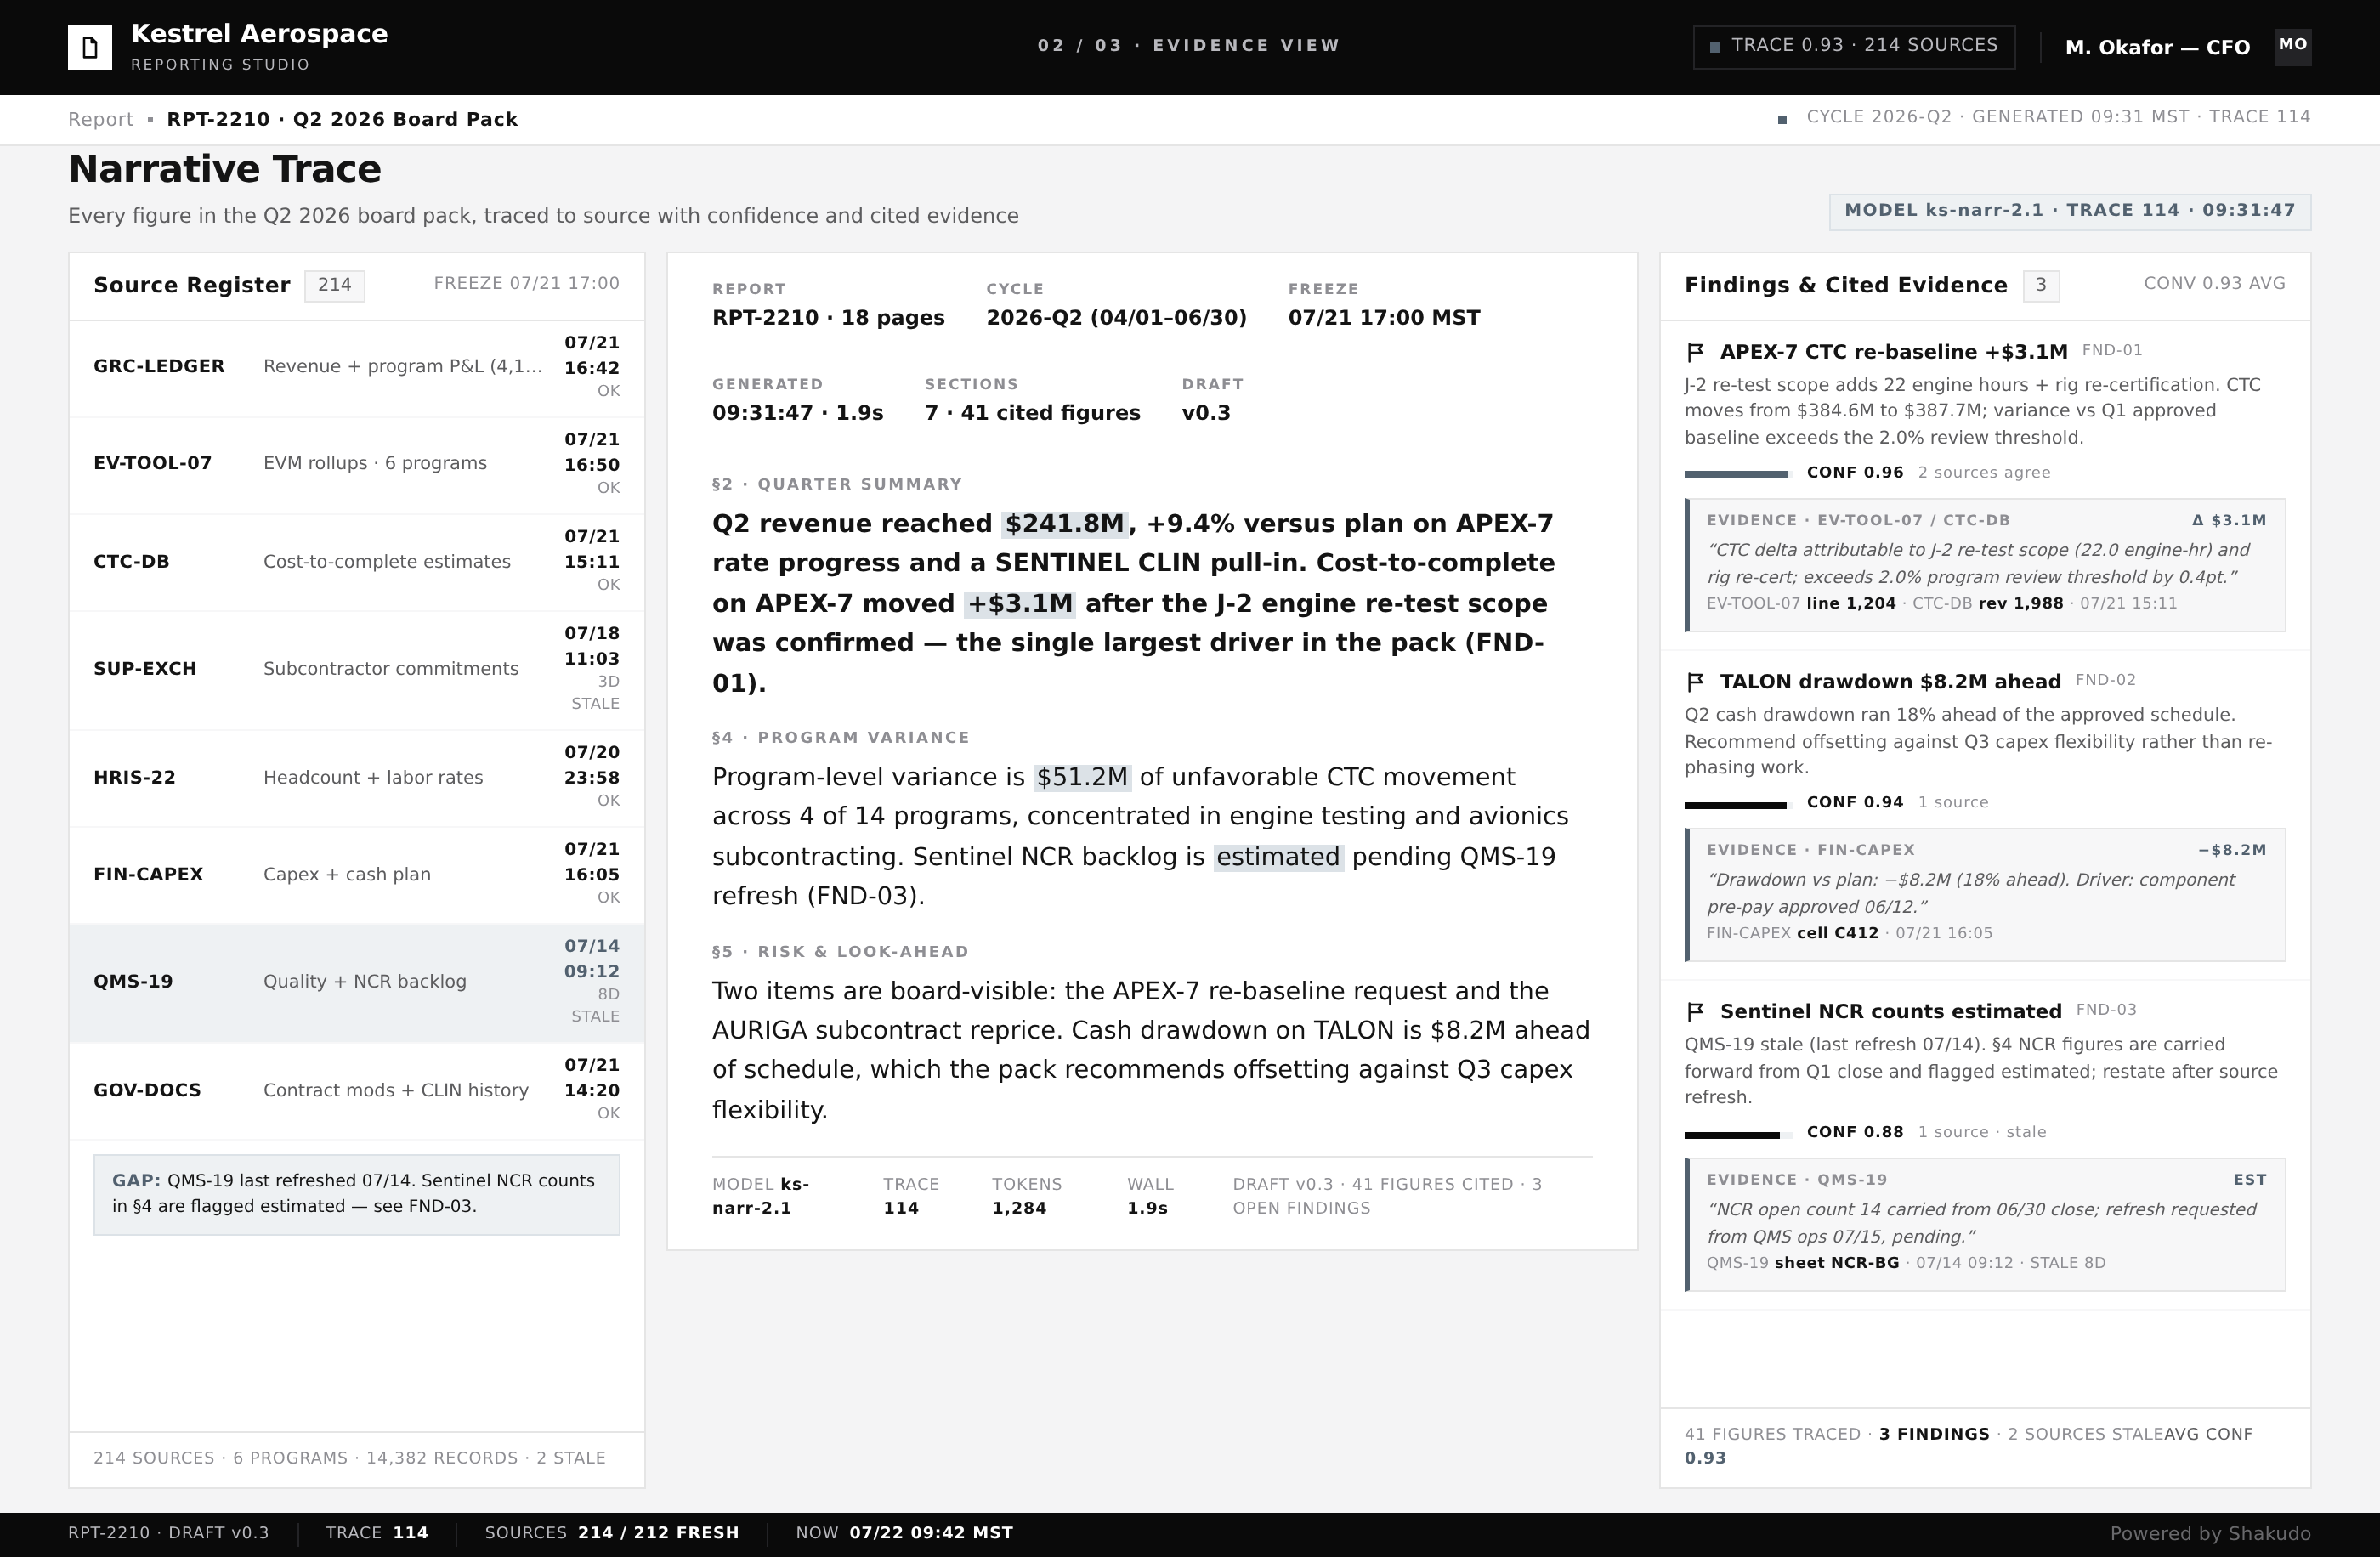
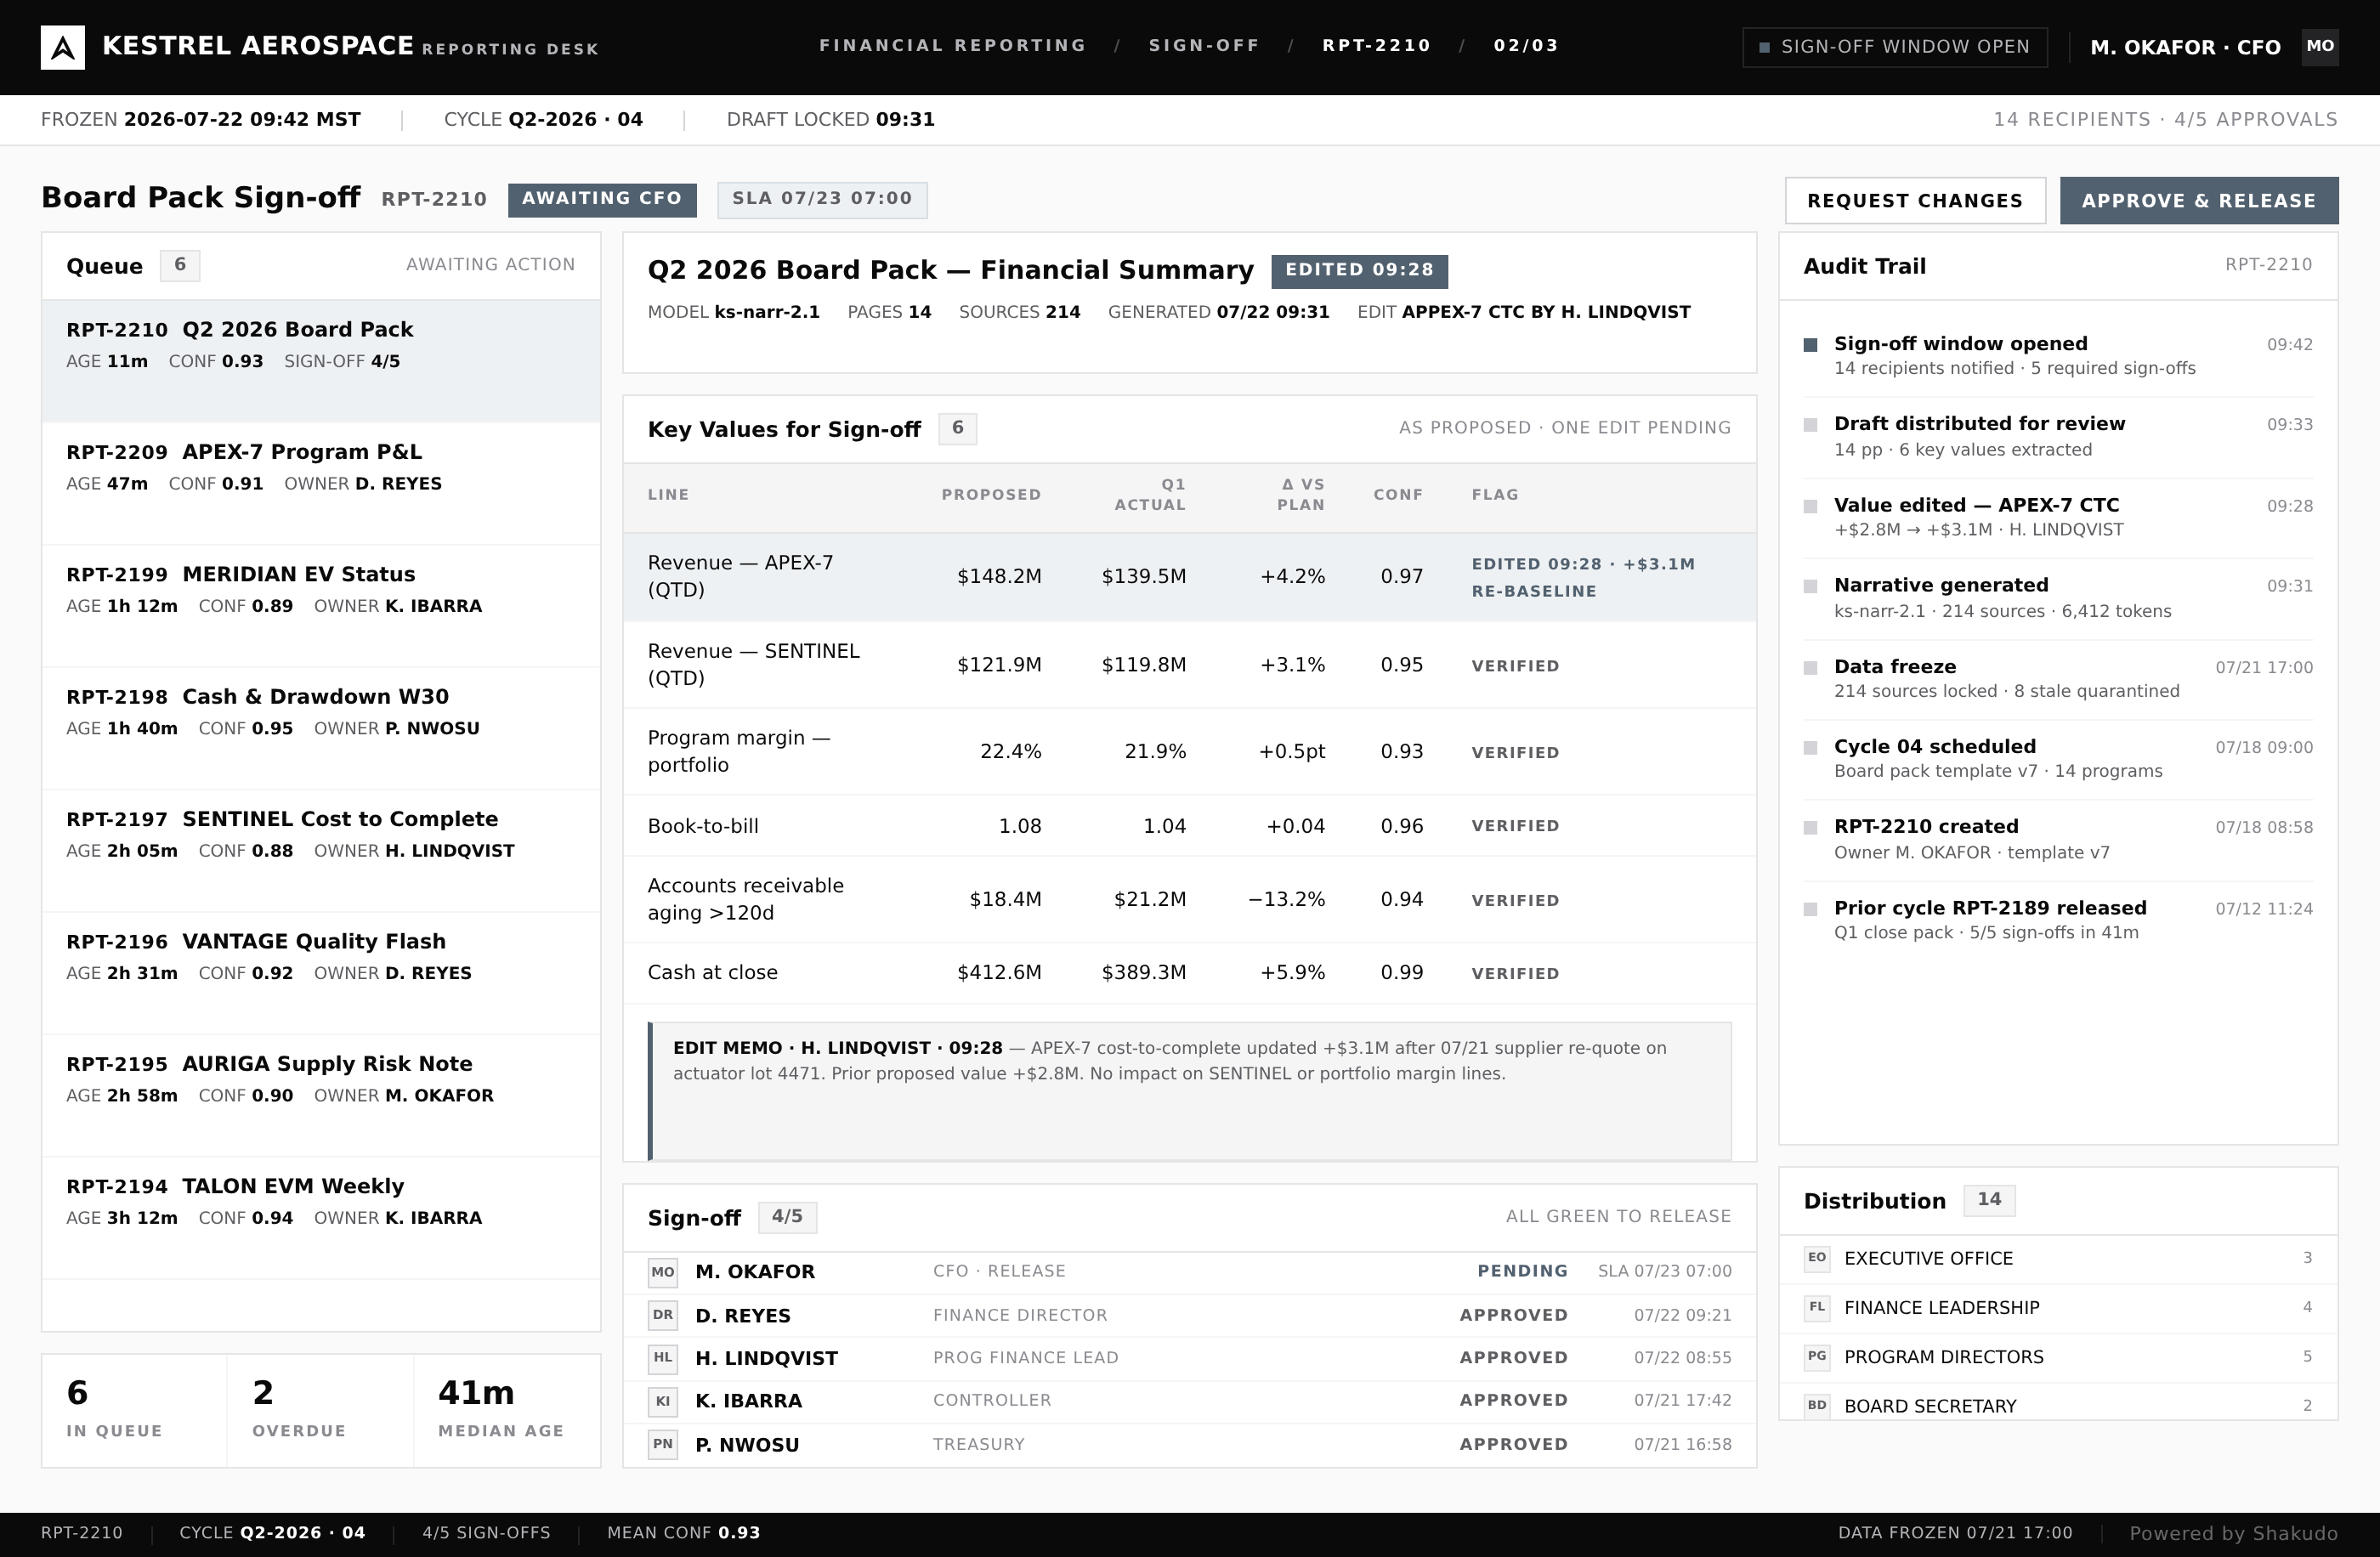
Three screens from a live run: the report queue, the generated summary, and the executive review.
1–2 / 3
Retail executives spend days each month pulling data from sales, inventory, and HR systems to build board-ready reports, and the work falls to analysts who lose 60 to 80 percent of their time just gathering and formatting it. An automated reporting pipeline changes that: a board brief that once took days now generates in roughly 15 minutes, with every figure traced to a validated source record.
Executive reporting is the most expensive reporting in any organization, not because the tools cost more but because the time invested is enormous. Finance teams spend days compiling board decks, department heads lose hours preparing quarterly business reviews, and CEOs and founders spend weekends building investor updates. In retail the problem compounds because data lives across point-of-sale systems, inventory management platforms, HR databases, and supply chain tools that were never designed to talk to each other.
Analysts spend 60 to 80 percent of their time gathering and formatting data rather than analyzing it. KPIs get dumped into slides without narrative context, so directors receive numbers but not insight. By the time a report reaches leadership the data is already days old, and decisions made on stale information cost retailers missed opportunities and slow responses to market shifts. A regional inventory shortage detected in real time becomes a crisis when it surfaces in a monthly board deck three weeks later.
Shakudo delivers an automated reporting pipeline that connects directly to your data sources and generates natural language summaries on a schedule. Instead of exporting spreadsheets and building charts by hand, the system pulls sales figures, inventory levels, and HR metrics from source systems, then uses large language models to identify trends and anomalies and write narrative summaries in plain language.
For a retail organization the pipeline can report that same-store sales rose 4.2 percent week over week, flag that inventory turnover dropped in three regions, and note that seasonal hiring is tracking behind plan. Each figure traces back to validated source data, so the AI does not invent numbers. Retailers that have implemented this approach report cutting report preparation time from days to roughly 15 minutes per brief, and the same pipeline can produce different views for different audiences: a high-level summary for the board, a detailed operational report for store managers, and an investor update formatted for external distribution.
Building the pipeline comes down to three components, and the validation step is where board-level trust is won.
The time saved shifts analyst focus from data gathering to strategic analysis, which is where their expertise delivers the most value.
This is for the operations and finance teams in retail organizations that own the reporting cycle: finance teams compiling board decks, department heads preparing quarterly reviews, and store or regional managers who need operational detail. It fits retail operators whose data is spread across point-of-sale, inventory, HR, and supply chain systems and who need a single executive view without a dedicated data team rebuilding it by hand.
Most retail organizations can deploy an automated reporting pipeline in 4 to 6 weeks. The timeline depends on how many data sources need connecting and how much formatting customization the executive team requires. Teams with clean, well-documented data infrastructure move faster.
Yes, when built with proper validation. Each figure should trace to a specific source record rather than a model-generated estimate. Many organizations add a human review step for board materials while letting operational summaries generate automatically. The AI reads from connected systems rather than inventing numbers.
Common sources include point-of-sale systems, inventory management platforms, ERP databases, HR systems, supply chain tools, and CRM platforms. The pipeline connects to each source on a schedule, pulls relevant metrics, and consolidates them into a single executive view. Custom connectors can be built for proprietary systems.
Organizations report reducing report preparation from days to approximately 15 minutes per brief. Analysts shift from manual data gathering to analysis and strategy. The time savings compound across weekly, monthly, and quarterly reporting cycles, freeing hundreds of hours per year for higher-value work.
When the goal is board reporting your team can trust, a conversation with Shakudo is the fastest way to see it on your own data. The pipeline deploys on your infrastructure, on-prem or in your cloud, a first working pipeline is in place within days, and you can book a demo to watch it run.
AI-driven reporting pulls data from sales, inventory, and HR systems to generate natural language summaries and formatted executive briefs automatically. Leadership receives accurate, timely intelligence without manual data gathering or formatting.










"What drew me in is simple. When developers ship production-ready code this quickly, how can I have environments spun up fast enough? Shakudo is how we close that gap."



"Shakudo does not just provide the platform. It is a real partnership. They are always there to help and execute our vision faster and the right way. It is like a co-team working together to achieve our goals."