







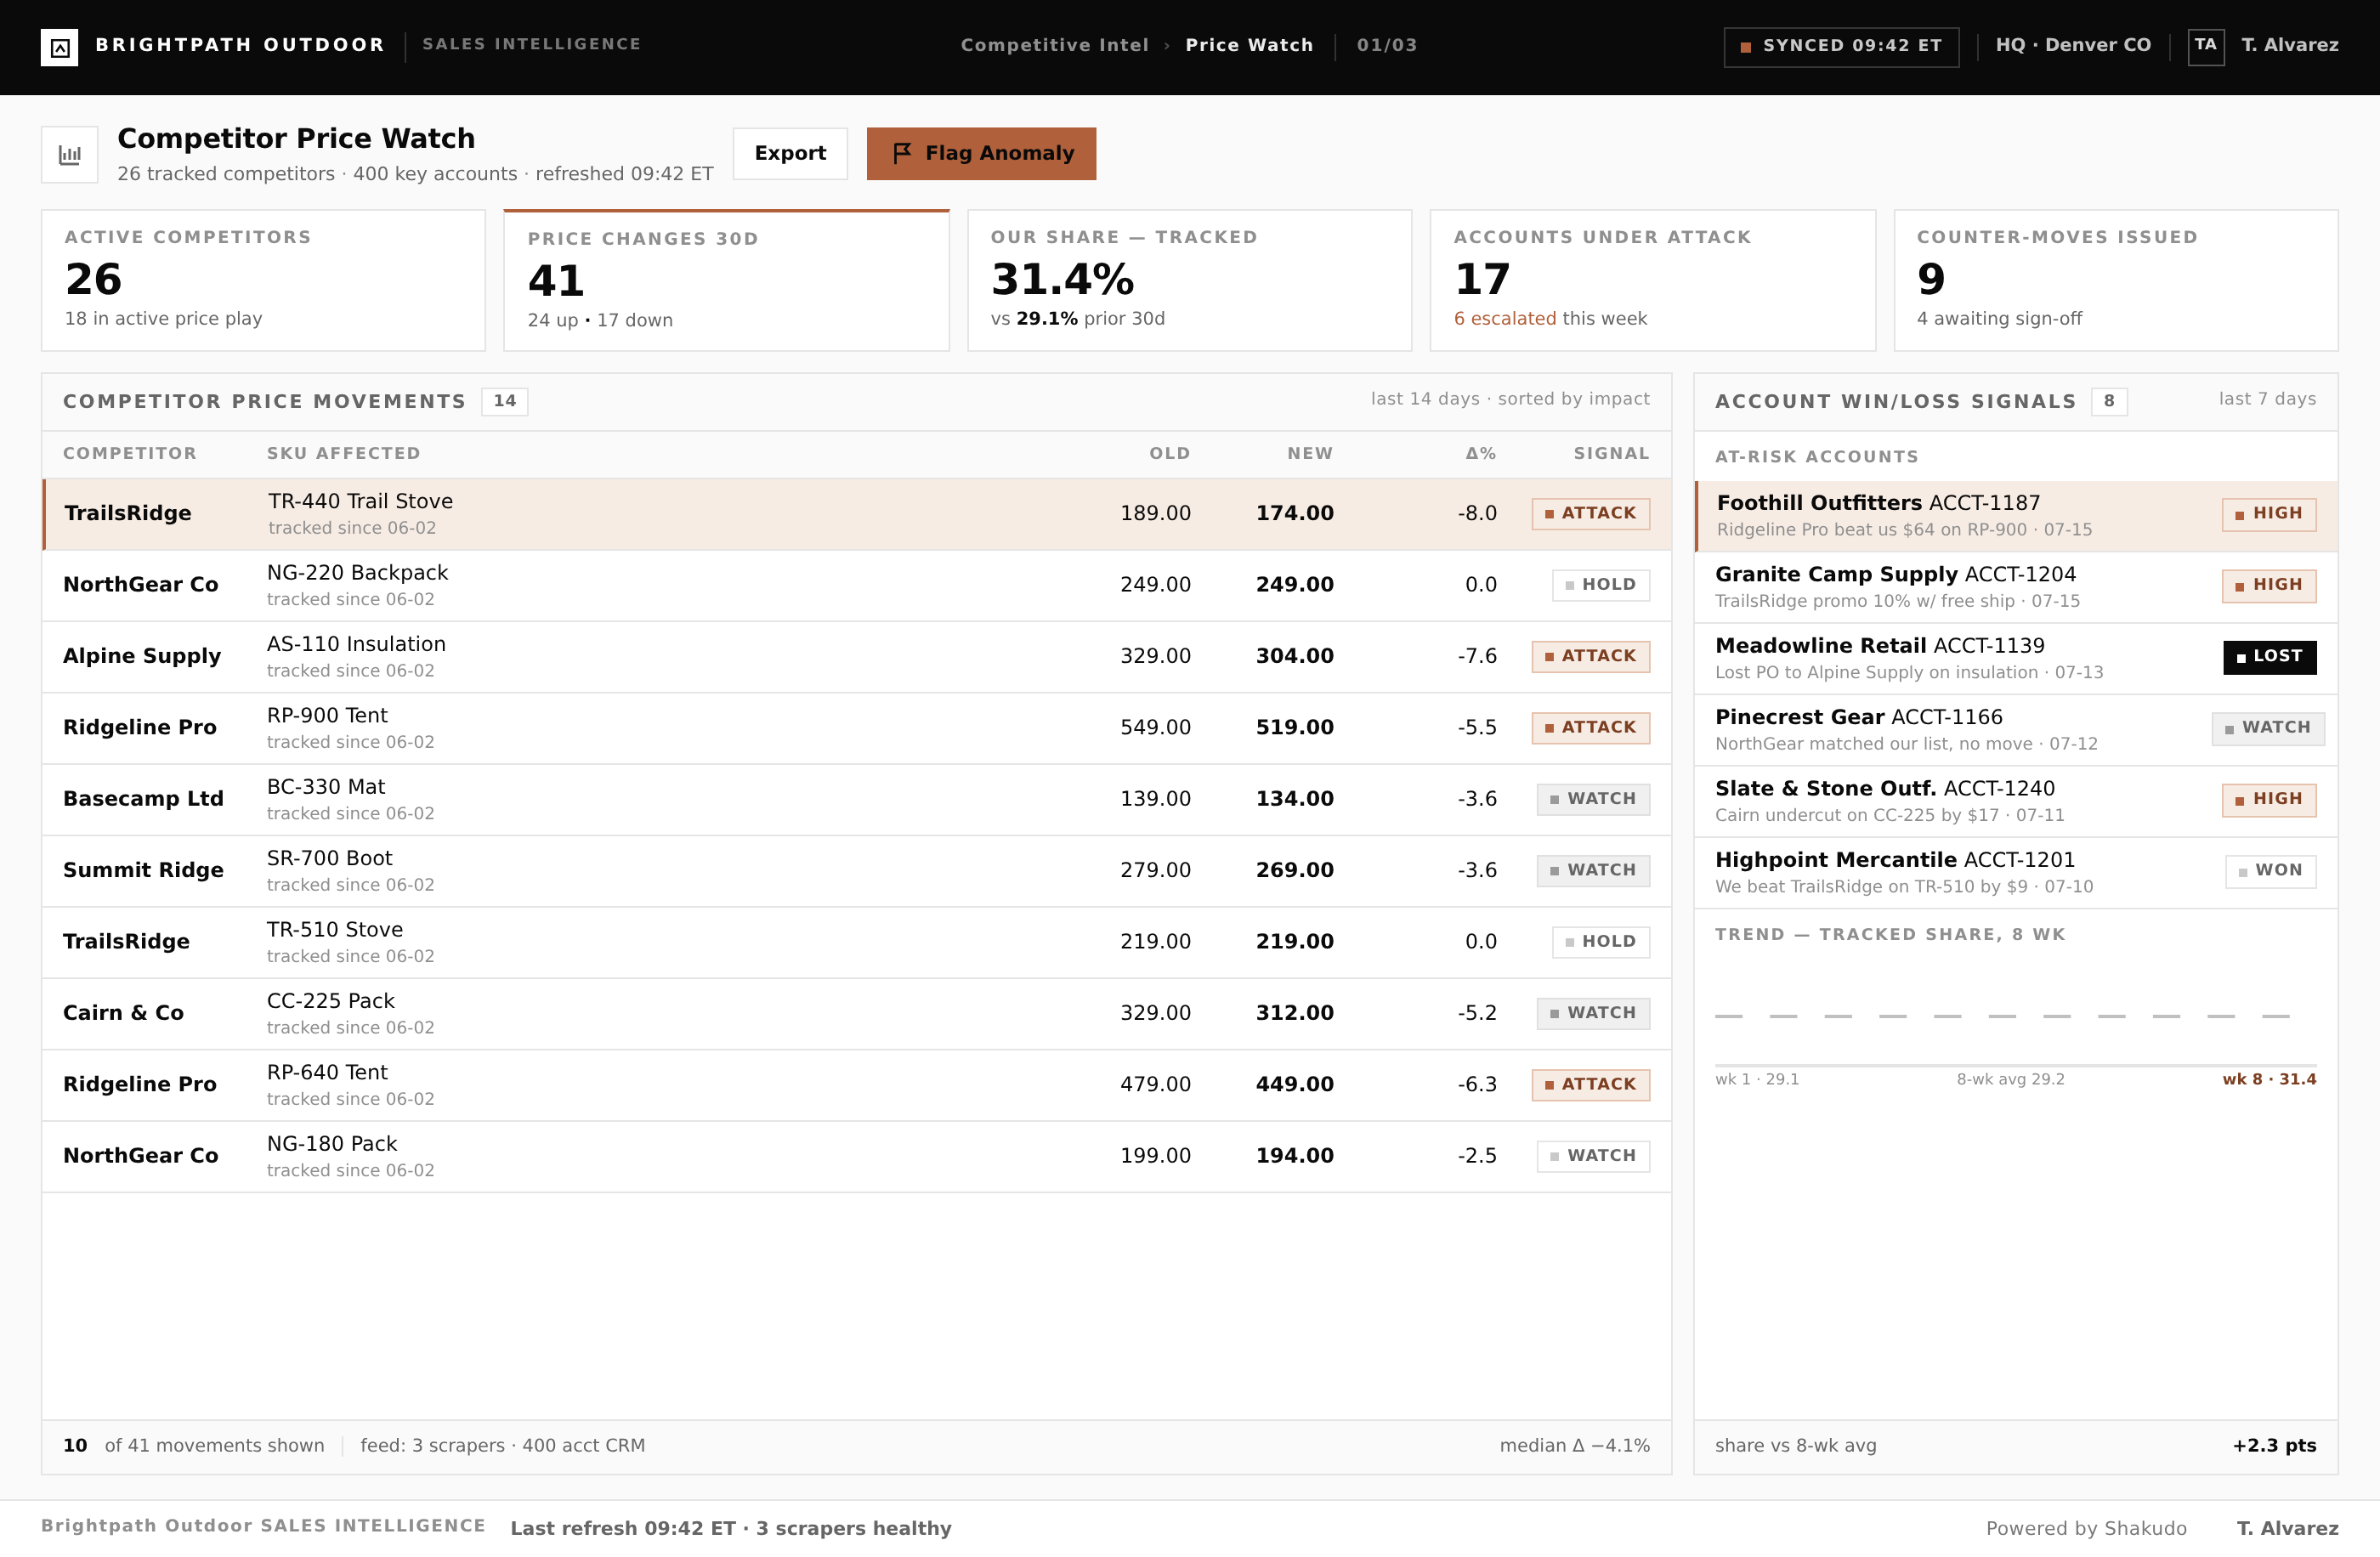
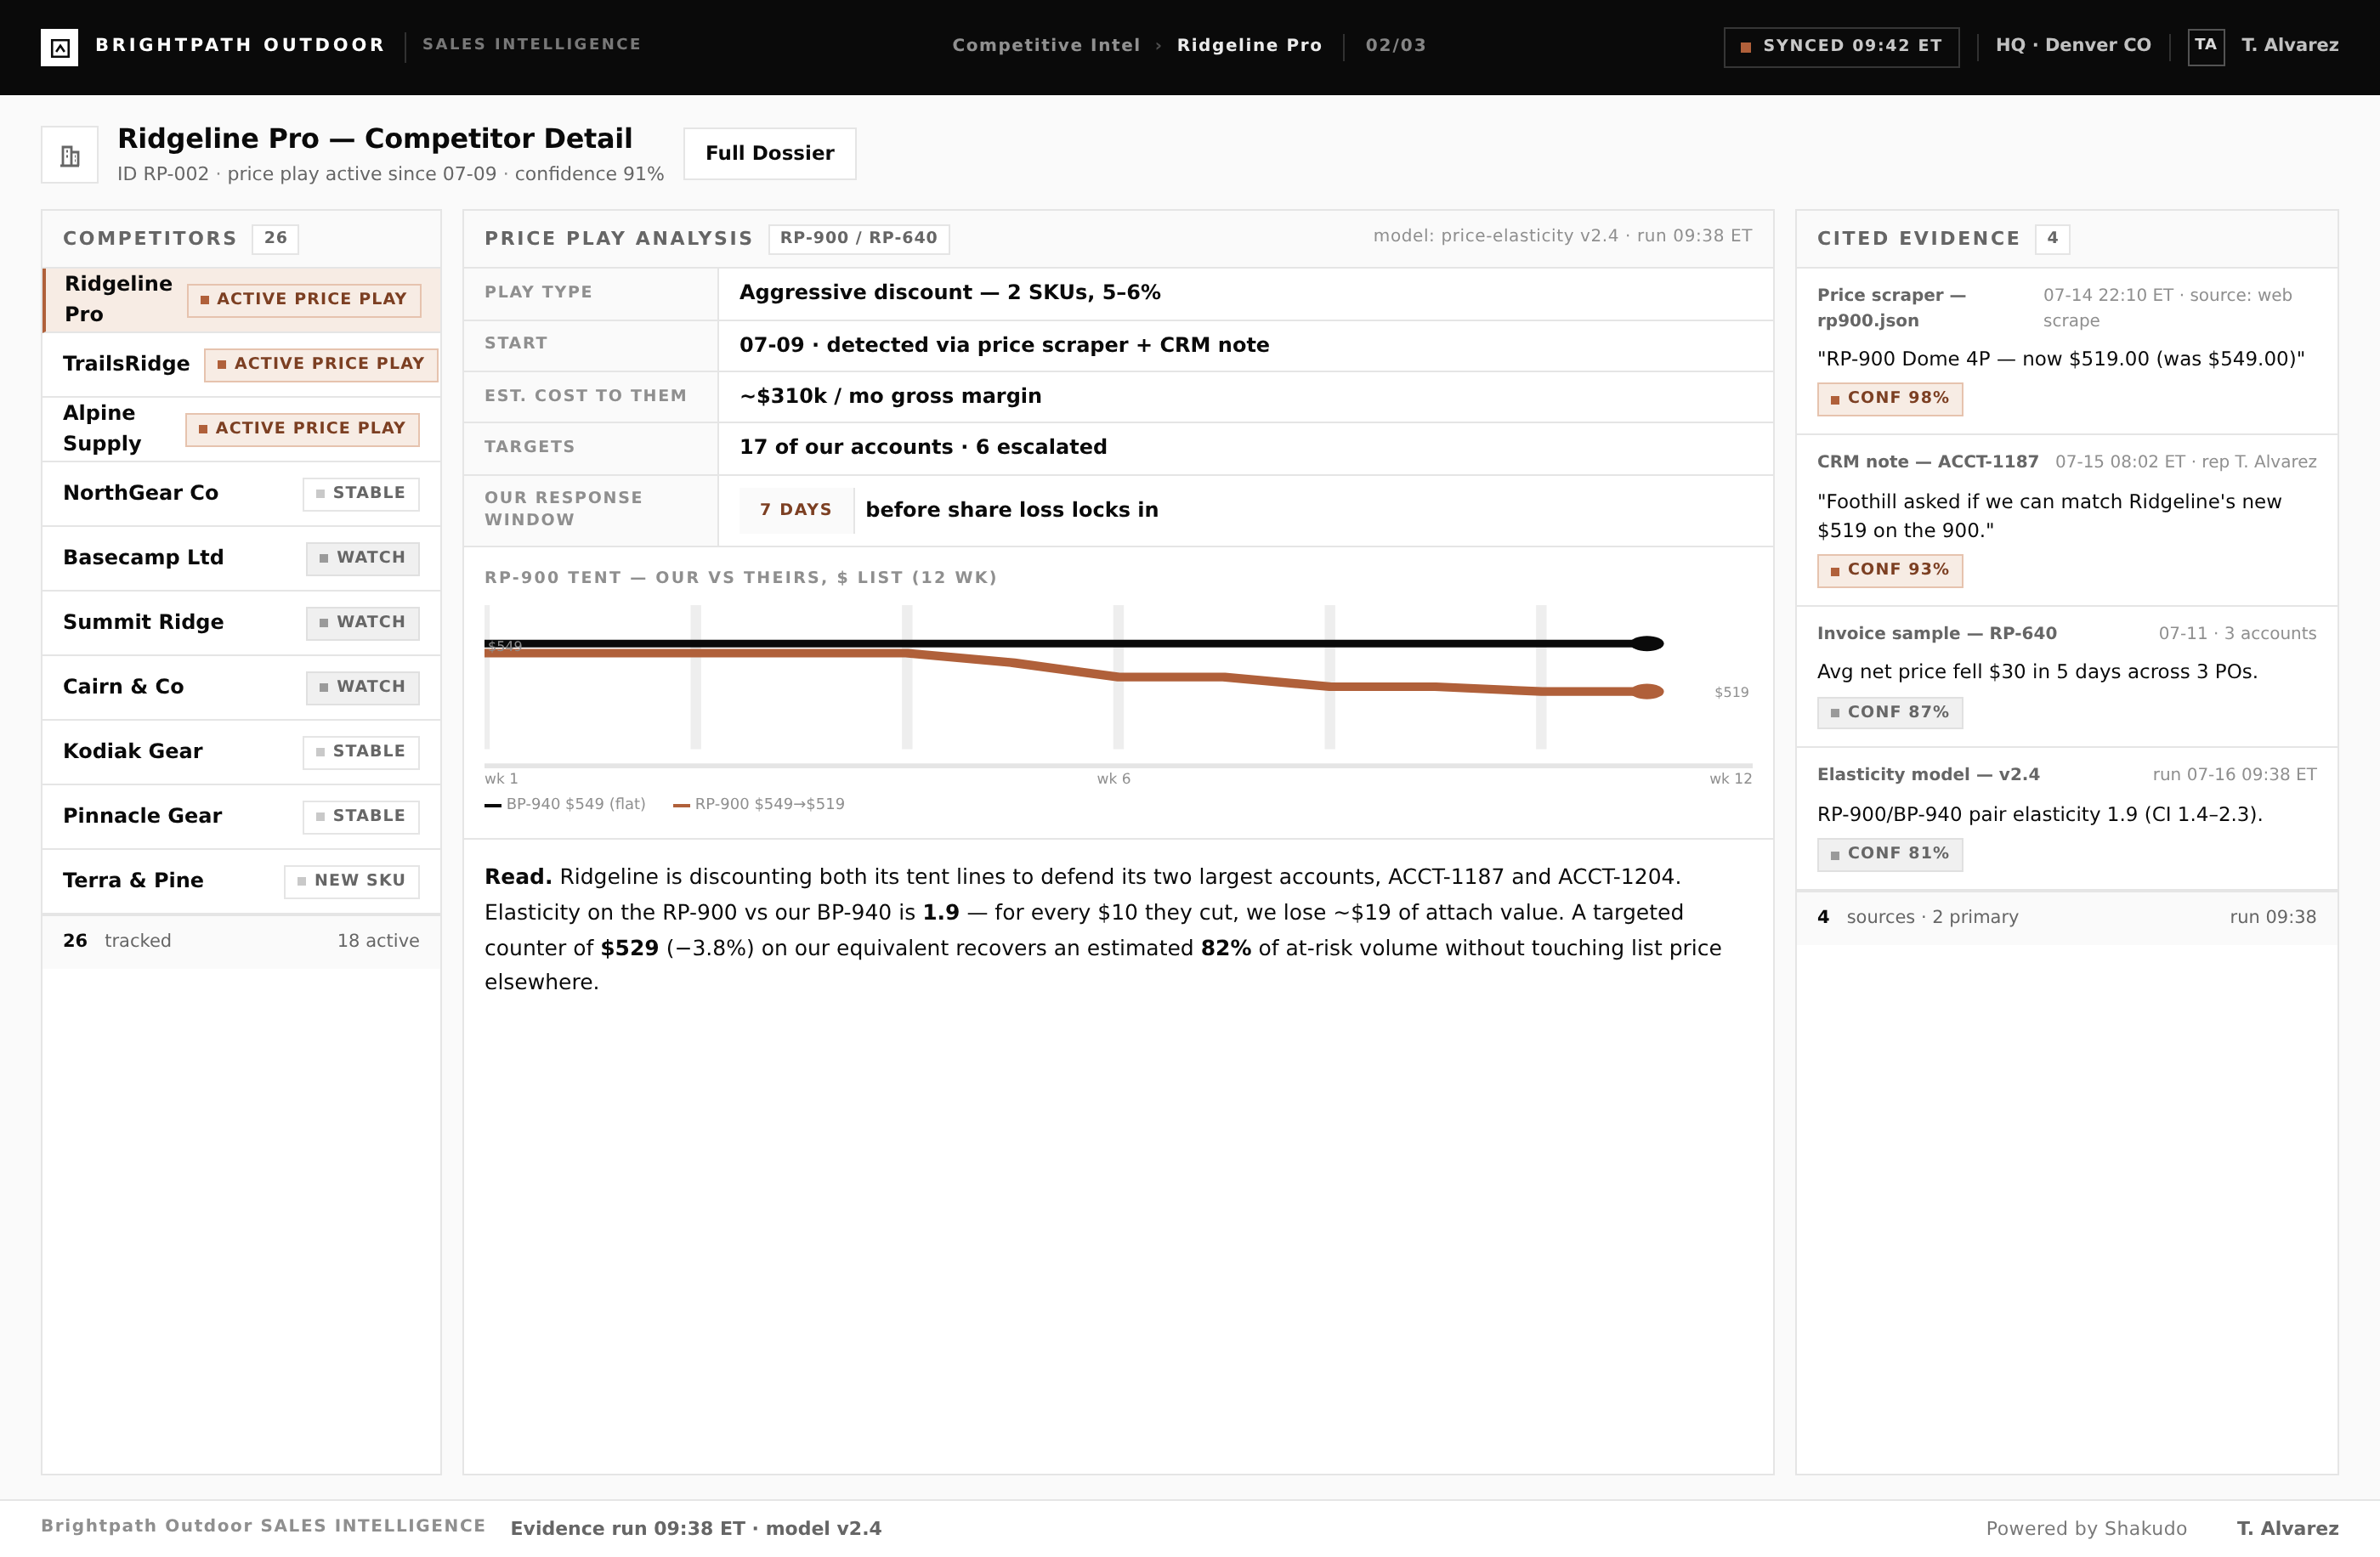
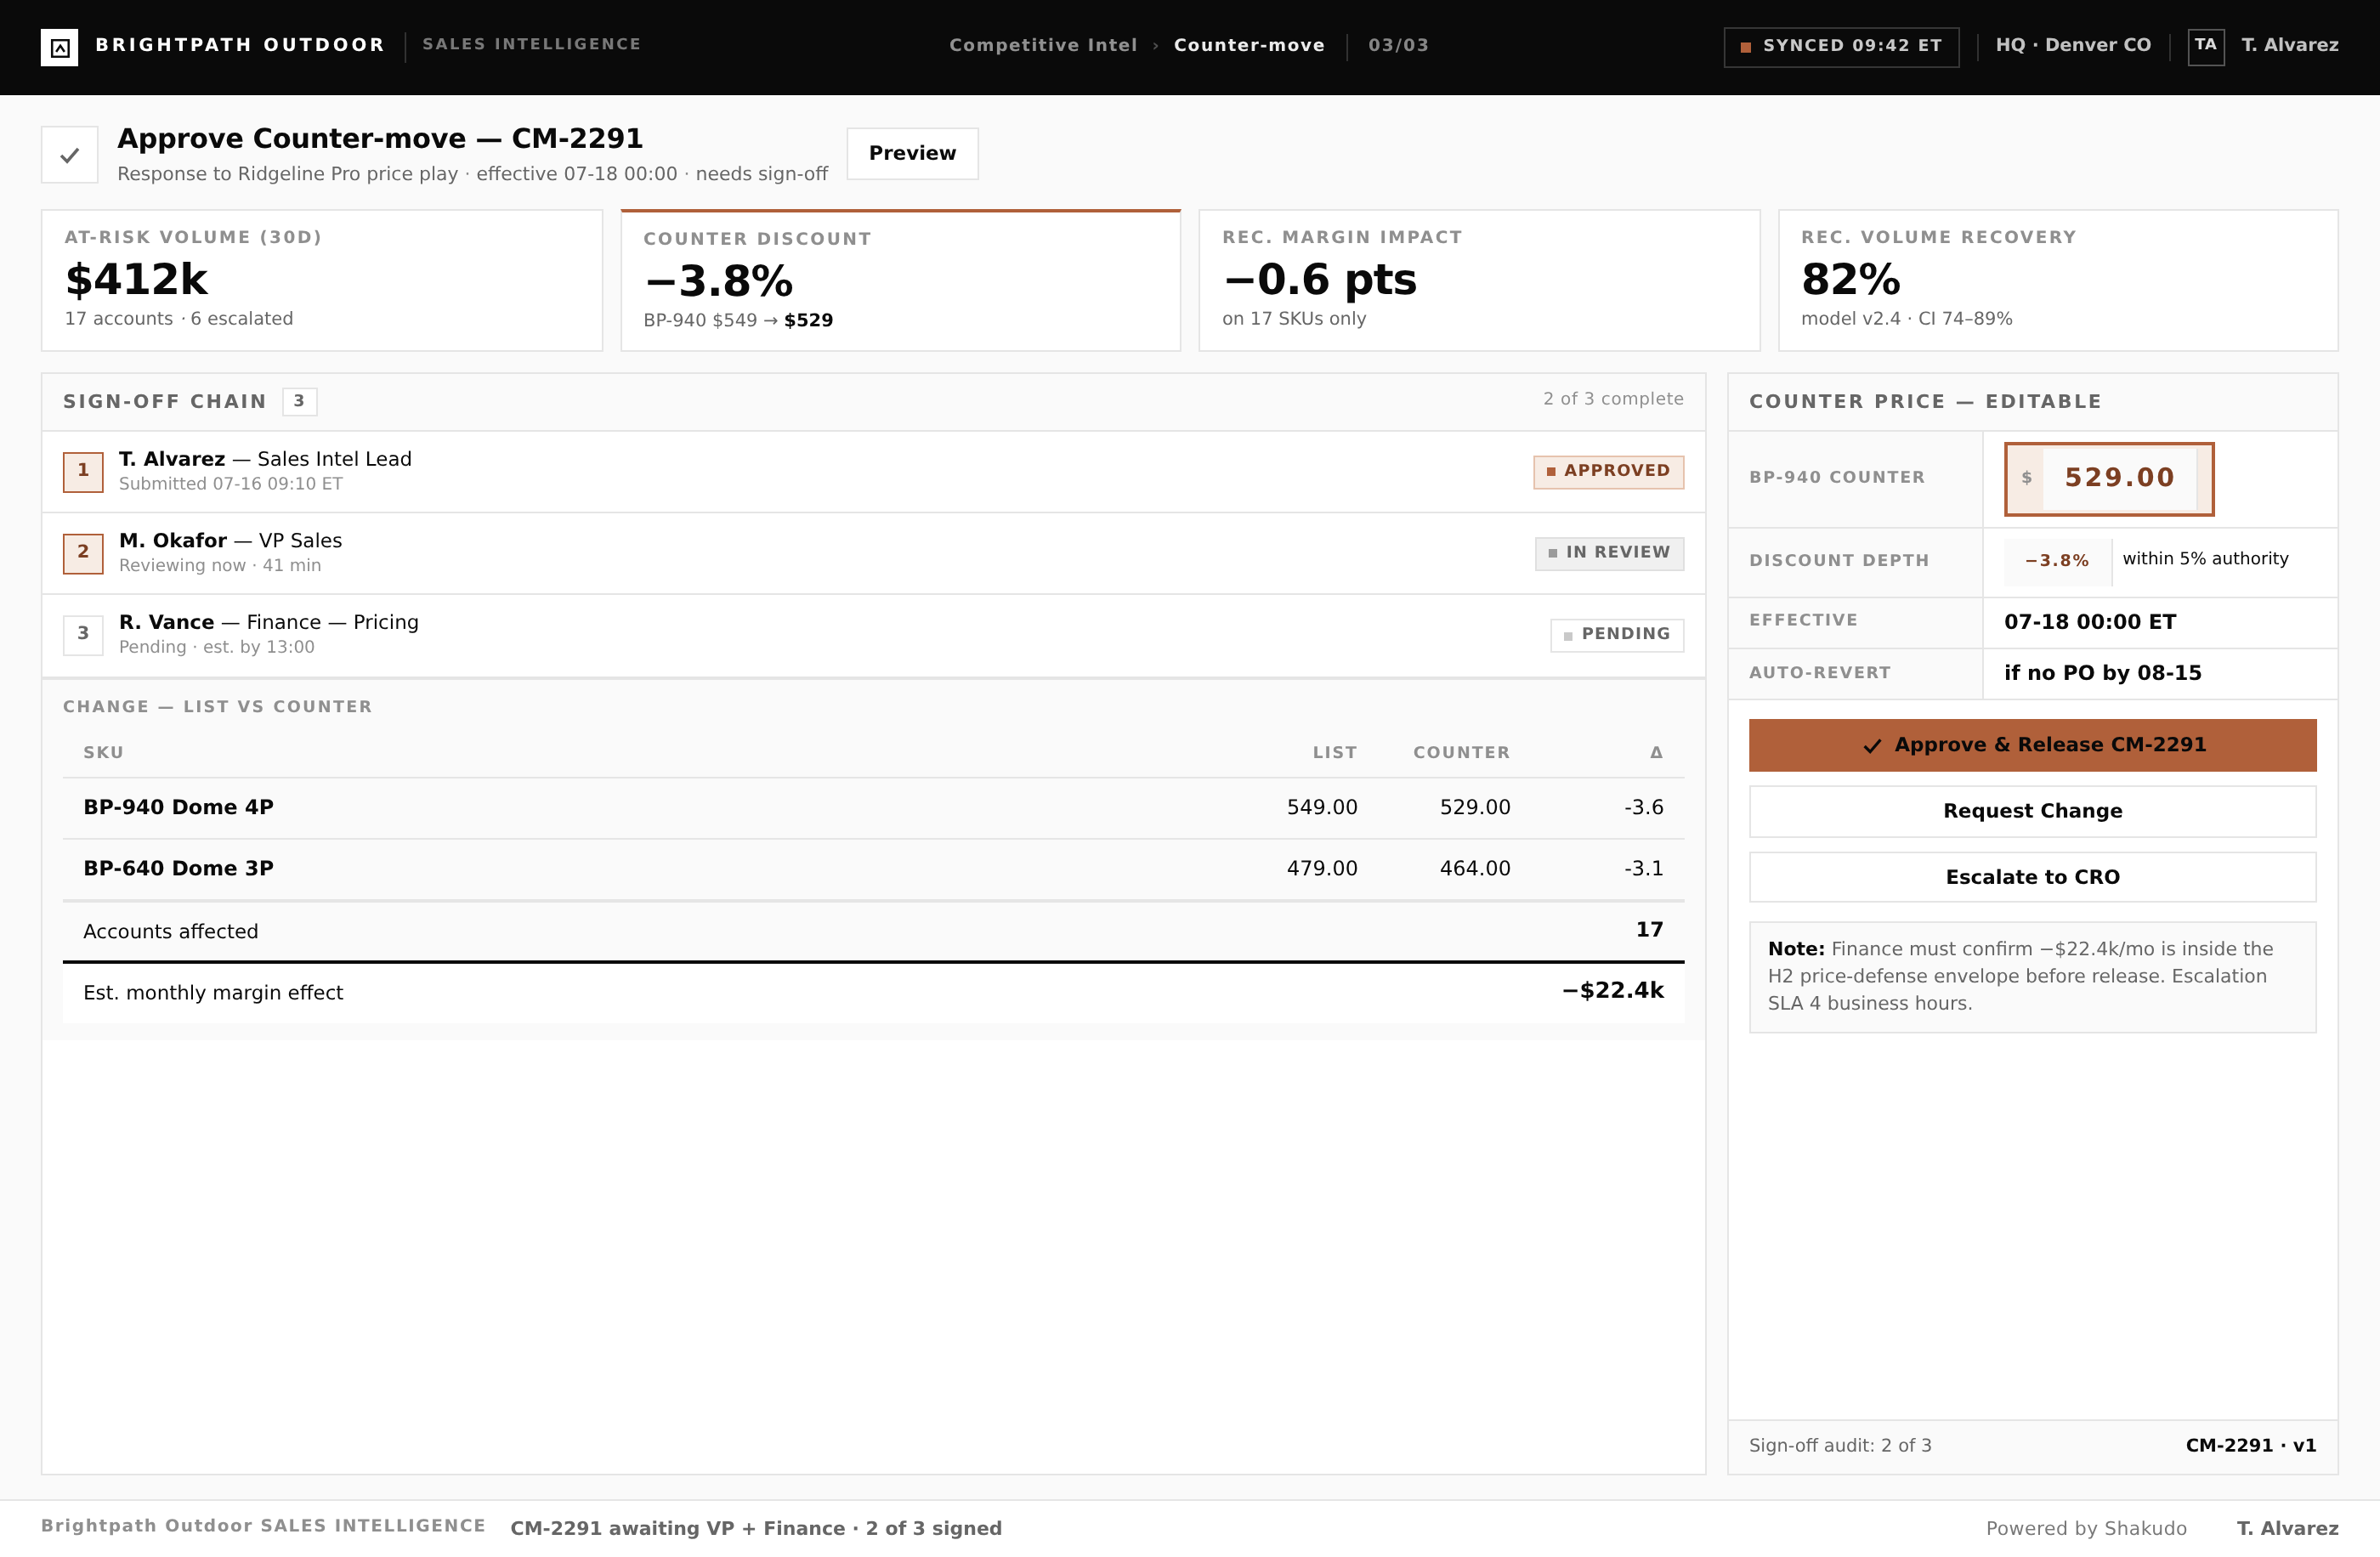
Three screens from a live run: the account board, the deal analysis, and the win-plan review.
1–2 / 3
Analysts at investment firms spend 15 to 20 hours per week manually scanning news sites, regulatory filings, social media, and pricing pages. A pricing change detected on day one versus day five can shift an entire investment thesis, yet manual tracking means signals arrive late, stale, or not at all. A sales intelligence dashboard aggregates competitor activity into one continuously updated view, so the team sees market movements the day they happen instead of the week after.
Investment firms depend on timely competitive intelligence to inform portfolio decisions, identify market shifts, and brief stakeholders. Yet most teams still track competitors through a patchwork of browser tabs, spreadsheets, and email alerts. Organizations monitoring 20 or more signal types catch market movements days earlier than those relying on manual methods, and the gap compounds as coverage grows. Analysts tend to monitor the competitors they know well, missing emerging players or adjacent market moves.
By the time a signal reaches the investment committee, it has often been summarized, filtered, and delayed through multiple handoffs. The result is a competitive picture that is both incomplete and outdated by the time decision makers see it.
Shakudo builds the dashboard inside the customer's own environment, so the competitive intelligence pipeline runs where the firm's data already lives. The result is one interface instead of a dozen tabs: news APIs, regulatory filing feeds, social media streams, job boards, and pricing page monitors all flow into a centralized processing layer, and each incoming signal is classified by competitor, topic, and relevance, with sentiment analysis flagging whether a mention represents a positive or negative market event.
The measurable outcomes: analyst time spent on manual competitor research drops by 60 percent, signal detection improves from an average of three days to under two hours, and coverage expands from the handful of competitors a team tracks by hand to a full competitive set. Investment committees receive weekly briefings generated from the dashboard, and the pipeline keeps running after the engagement ends, with the firm owning the connectors, the models, and the data.
A financial services firm ran this pattern end to end: ingestion pipelines connected to news APIs, SEC filing feeds, and social media monitoring, with the vector database holding the historical record behind the filterable front end. The same architecture applies across sectors, with source feeds and classification rules adjusted per industry.
The dashboard fits investment firms and financial services teams that brief stakeholders on competitive dynamics, portfolio monitoring teams that need a current picture of the market, and any operations team that currently compiles competitive intelligence by hand. It suits organizations tracking a full competitive set, not just the rivals they already know, and need signal detection measured in hours rather than days.
The dashboard pulls from news APIs, regulatory filings, social media platforms, job boards, pricing pages, and press release feeds. Most implementations connect 20 or more sources, with each feed processed by NLP pipelines that classify and score signals before they appear on the dashboard.
A typical deployment takes 4 to 6 weeks. The core data pipelines, source connectors, and dashboard interface can be configured in the first 2 weeks. Fine-tuning signal classification models, setting up alerting rules, validating output quality, and integrating with existing reporting tools usually takes the remaining time. Teams can start with a subset of sources and expand coverage incrementally.
No. The dashboard handles the repetitive work of collecting and classifying signals, freeing analysts to focus on interpretation and strategy. Analysts still review flagged signals, contextualize findings, and present recommendations. The tool removes manual data gathering, not analytical judgment.
Yes. The signal classification layer can be configured for any industry. Financial services firms use it to track portfolio companies and market competitors. The same architecture applies to technology, healthcare, or manufacturing, with source feeds and classification rules adjusted per sector.
When the goal is a competitive picture that updates as the market moves, a conversation with Shakudo is the fastest way to see it on your own source set. The pipeline deploys in your own environment, and a first working dashboard is in place within days. Book a demo to watch it classify live signals.
Aggregate competitor signals, news mentions, and market movements into one real-time view. Investment teams monitor pricing changes, hiring shifts, and product launches as they happen, cutting manual research by hours each week.










"What drew me in is simple. When developers ship production-ready code this quickly, how can I have environments spun up fast enough? Shakudo is how we close that gap."



"Shakudo does not just provide the platform. It is a real partnership. They are always there to help and execute our vision faster and the right way. It is like a co-team working together to achieve our goals."