
TL;DR: vLLM’s prefix caching delivers up to 112× TTFT speedup for cached prompts, but there’s no API to check whether a request will hit the cache before you submit it. We tried sending probe requests to measure cache state - they contaminated the very cache they measured. The solution: a sidecar that subscribes to vLLM’s ZMQ KV cache events, maintains a local hash-based index using FNV-64a over CBOR-encoded block keys, and exposes a REST endpoint for pre-request cache hit prediction at ~7ms latency with ~80% accuracy and zero cache contamination.
vLLM’s automatic prefix caching (APC) is one of the most impactful optimizations for self-hosted LLM inference. When multiple requests share a common prompt prefix - a system prompt, a RAG context, a few-shot template - vLLM reuses the cached KV (key-value) tensors from prior requests instead of recomputing them. The payoff is dramatic: time-to-first-token (TTFT) speedup scales from 2× at 64 prompt tokens to 112× at 32K prompt tokens with near-perfect cache hit rates.
But here’s the gap: vLLM has no public API to predict whether a request will hit the cache before you submit it.
What vLLM does expose:
cached_tokens in the response usage field - but only after the request completes (and only if you enable --enable-prompt-tokens-details).vllm:prompt_cache_hits and vllm:prompt_cache_misses - useful for dashboards, useless for per-request routing.What vLLM doesn’t expose:
This isn’t just a vLLM problem. We surveyed every major open-source inference engine - SGLang (RadixAttention), TensorRT-LLM, LMDeploy, mlc-llm, TGI, llm-d, Ray Serve, NVIDIA Dynamo/NIXL - and none of them exposes a stable public pre-request KV cache-hit prediction API.
Without preflight prediction, two important capabilities are impossible:
To understand why this is hard, you need to understand vLLM’s cache internals:
sha256_cbor (or xxhash_cbor depending on version) for its prefix cache keys. This is important later.The key takeaway: vLLM’s cache is a write-on-read, block-granular, content-addressed structure with no query interface. You can only learn its state by writing to it.
If you can’t query the cache, maybe you can measure it. The approach:
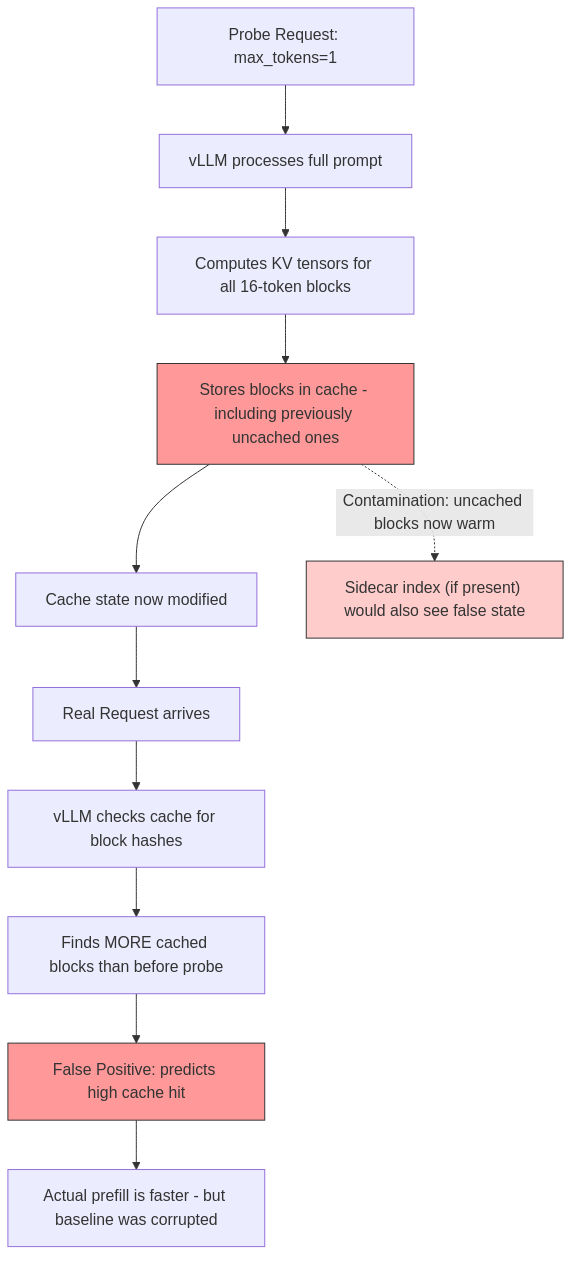
max_tokens=1 inference probe with the target prompt.cached_tokens from the response usage.cached_tokens > 0, the prompt (partially) hit the cache. Use that information for routing.The probe request itself warms additional cache blocks. Here’s why:
vLLM caches full 16-token blocks. When you send a probe with max_tokens=1, vLLM processes the entire prompt, computing and storing KV tensors for every complete 16-token block. The generated token adds one more token to the final partial block - but more importantly, every full block in the prompt is now cached, even if it wasn’t before.
So when the real request arrives, it sees more cached tokens than the probe predicted. For partial-hit prompts - where only some blocks were previously cached - the contamination is worst. The probe warmed the uncached blocks, making the real request appear to have a higher cache hit rate than it actually did before the probe.
You cannot measure a cache by writing to it. The probe approach is fundamentally broken because the measurement instrument changes the system being measured.
This isn’t a bug you can work around. It’s a thermodynamic constraint of the design: vLLM’s cache is write-on-read, and a probe is a read. Any approach that submits inference requests to learn cache state will contaminate the cache. The solution must observe the cache without triggering cache writes.
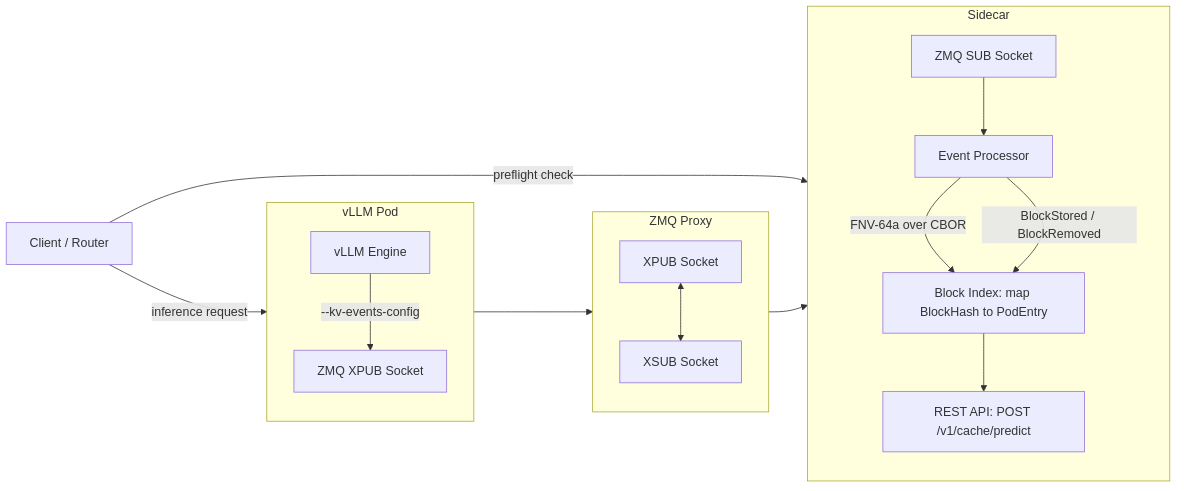
Starting with recent versions, vLLM can publish KV cache events over ZeroMQ (ZMQ). You enable it with the --kv-events-config flag:
vllm serve Qwen/Qwen3-32B-FP8 \
  --enable-prefix-caching \
  --enable-prompt-tokens-details \
  --kv-events-config '{"enable_kv_cache_events":true,"endpoint":"tcp://0.0.0.0:5557","topic":"kv@vllm-0@Qwen/Qwen3-32B-FP8"}'
When enabled, vLLM publishes events whenever cache blocks are stored, removed, or cleared. The event format is:
kv@{vllm-instance}@{model-name} (e.g., kv@vllm-0@Qwen/Qwen3-32B-FP8)BlockStored, BlockRemoved, AllBlocksClearedparent_block_hash field for chain linkage - the hash of the preceding block, which is how blocks are linked into prefix chains.The solution is a cache-preflight sidecar - an independent service that observes cache state without sending inference requests.

Data flow for a prediction request:
POST /v1/cache/predict with the prompt text./render endpoint (through nginx, which handles TLS termination, API key auth, and rate limiting).This is the crux of the solution. To predict cache hits, the sidecar must compute the same block keys that vLLM uses - without access to vLLM’s internal hash function.
Here’s the subtlety: vLLM internally uses sha256_cbor for its prefix cache keys. But the ZMQ events that vLLM publishes use a different key scheme - one derived from llm-d’s precise-prefix-cache protocol, which uses FNV-64a over canonical CBOR-encoded payloads.
Why the difference? The ZMQ event system includes a dual-key bridge that maps vLLM’s internal engine keys to llm-d-compatible request keys on BlockStored events. The sidecar only needs the FNV-64a request keys for lookups - it never needs to replicate vLLM’s internal sha256_cbor.
The block key computation:

Where:
parent_block_hash starts from a hashSeed derived from the model name (via TokenProcessor.TokensToKVBlockKeys)token_chunk is the 16-token slicenil is the explicit nil/extra field from llm-d’s protocolcanonical_cbor_encode produces deterministic CBOR (sorted map keys, minimal encoding)fnv_64a is the standard Fowler-Noll-Vo 64-bit hashThis chained computation means block hashes are content-addressable and position-dependent - the same 16 tokens at different positions in a prompt produce different hashes, which is correct because their KV tensors differ.

The sidecar maintains an in-memory index:
type CacheIndex struct {
    mu    sync.RWMutex
    blocks map[BlockHash][]PodEntry
}

type PodEntry struct {
    PodID    string
    Model    string
    StoredAt time.Time
}
When a BlockStored event arrives over ZMQ, the sidecar extracts the block hash and pod ID and adds an entry. When a BlockRemoved event arrives, it removes the corresponding entry. The AllBlocksCleared event flushes all entries for that pod.
POST /v1/cache/predict
Content-Type: application/json

{
  "model": "Qwen/Qwen3-32B-FP8",
  "messages": [{"role": "user", "content": "Explain prefix caching..."}]
}
Response:
{
  "predicted_cached_tokens": 2048,
  "total_prompt_tokens": 4096,
  "blocks_total": 256,
  "blocks_cached": 128,
  "cache_hit_ratio": 0.5,
  "pod_affinities": [
    {"pod_id": "vllm-0", "cached_blocks": 128}
  ]
}
The sidecar also exposes GET /stats (index size, event throughput) and GET /health for monitoring.
| Metric | Probe-Based | ZMQ Hash-Based |
|---|---|---|
| Prediction latency | ~47ms p50 | ~7ms |
| Cache contamination | Yes (fatal) | None |
| Accuracy | N/A (contaminated) | ~80% |
| Overhead on warm requests | 11.9% | 0% |
The sidecar cannot see pre-existing cache blocks. It only tracks blocks stored after it starts listening to ZMQ events. On restart, the index is empty - ZMQ doesn’t replay historical events.
This means:
Future hardening: A shared Redis/Valkey index could persist block state across sidecar restarts. Multiple sidecar instances could read from the shared index instead of each maintaining their own ZMQ subscription. This is deferred for the MVP but straightforward to add.
A few practical notes for anyone implementing this:
go-zeromq vs pyzmq incompatibility: vLLM’s ZMQ publisher (written in Python with pyzmq) and a Go-based sidecar subscriber (using go-zeromq) can have ZMTP protocol incompatibilities. The reliable path is a direct PUB→SUB connection without an intermediary proxy if you’re mixing languages, or use a pure-Python sidecar.
bind vs connect semantics: vLLM’s ZmqEventPublisher binds the PUB socket (server side), so the sidecar must connect (client side) to vLLM’s endpoint. If you add an XPUB/XSUB proxy in between for fan-out to multiple subscribers, the proxy binds XPUB and connects XSUB - vLLM connects to the proxy’s XSUB, subscribers connect to the proxy’s XPUB.
Topic filtering: Subscribers must set a topic filter to receive only relevant events. The topic format kv@{pod-id}@{model} lets you filter by model or by specific vLLM instance.
max_model_len=40960, max_num_seqs=8, tensor-parallel-size=1, gpu_memory_utilization=0.90, kv-cache-dtype=fp8| Phase | Throughput |
|---|---|
| Prefill | ~270,000 tokens/sec |
| Decode | ~40 tokens/sec |
This 6,750× asymmetry between prefill and decode throughput is the key to understanding when prefix caching matters.
To isolate the prefill speedup from decode, we set max_tokens=5 so generation is negligible. We tested cold cache (completely different content) vs warm cache (identical prefix) across prompt lengths:
| Prompt Length | TTFT Speedup (warm vs cold) |
|---|---|
| 16 tokens | 1.2× |
| 64 tokens | 2× |
| 256 tokens | 1.87× |
| 1K tokens | ~3× |
| 4K tokens | ~4× |
| 16K tokens | 4.5× |
| 32K tokens | up to 112× (near-full cache hit) |
At short prompt lengths, prefill is already fast (~sub-millisecond at 16 tokens), so the speedup ratio is modest. At 32K tokens, a cold prefill takes seconds while a warm one is nearly instant - hence the 112× ratio.
Here’s where the story changes. To measure total latency impact (not just TTFT), we forced full 8K-token generation using max_tokens=8192 and ignore_eos=True.
Note:
ignore_eos=Trueis essential for honest benchmarking. Without it, Qwen3-32B generated only 326-628 tokens despitemax_tokens=8192- the model stopped early on repetitive content, making decode time appear much shorter than it would in production.
| Prompt Length | TTFT Speedup | Total Latency Speedup |
|---|---|---|
| 64 tokens | 1.87× | 1.00× |
| 256 tokens | 1.87× | 1.00× |
| 1K tokens | ~3× | 1.00× |
| 4K tokens | ~4× | 1.00× |
| 16K tokens | 4.5× | 1.00× |
| 32K tokens | 1.01× | 1.00× |
Total latency speedup is exactly 1.00× across all prompt lengths.
Why? At ~40 tokens/sec decode speed, generating 8,192 tokens takes ~205 seconds. Prefill - even cold - takes only 0.04-0.12 seconds depending on prompt length. Decode dominates >99% of total request time. Prefix caching eliminates prefill cost, but prefill was never the bottleneck for long-output requests.
Prefix caching only matters for short-output workloads where prefill is the dominant cost:
For long-output workloads - creative writing, code generation, long-form summarization - prefix caching improves TTFT but has negligible impact on total latency. The decode phase dominates completely.
This is why cache-aware routing and preflight prediction are most valuable for RAG and extraction pipelines - the workloads where a 4× TTFT improvement translates directly to a 4× total latency improvement.
When benchmarking cold vs warm cache, beware of shared-prefix contamination. In our initial tests, we used prompts that shared a UUID prefix across cold and warm runs. At 32K prompt tokens, the “cold” run showed 99.8% cached_tokens - because the shared prefix was cached from the warm run.
True cold cache measurement requires completely different content - not just a different suffix. If any prefix overlap exists, vLLM will find and reuse those cached blocks, making your “cold” measurement secretly warm.
For context on why cache state is volatile (and why prediction is valuable), here’s how much memory KV cache consumes:
KV cache per token = 2 × num_kv_heads × num_layers × head_dim × dtype_sizeFor Qwen3-32B-FP8:
On an 80GB GPU with 32.5GB of weights, you have ~47GB for KV cache - enough for roughly 47K tokens total across all concurrent sequences. With max_num_seqs=8, each sequence gets ~5.9K tokens of cache budget. Long prompts will evict each other’s cache blocks under LRU, making cache-aware routing essential for maintaining hit rates.
llm-d is a separate project that provides cache-affinity routing across multiple vLLM replicas. It uses an Envoy → EPP (Endpoint Picker) → vLLM pipeline, where the EPP subscribes to ZMQ KV cache events to build a global cache index for routing decisions.
We considered using llm-d’s EPP directly, but there’s a critical limitation: llm-d’s EPP does not support custom HTTP endpoints. It only serves inference API paths (/v1/completions, /v1/chat/completions, etc.). There’s no way to add a /v1/cache/predict endpoint to the EPP itself.
This is why an external sidecar is necessary for client-facing cache prediction. The sidecar can run alongside the router, maintain its own ZMQ subscription and FNV-64a index, and expose whatever REST API you need - without modifying vLLM or llm-d.
The sidecar’s hashing algorithm deliberately matches llm-d’s protocol (FNV-64a over CBOR [parent_block_hash, token_chunk, nil]), so the two systems are compatible and could eventually share a Redis/Valkey-backed index.

Latency budget: 1-5ms for the hash computation + index lookup (tokenization via /render is the dominant cost, ~2-5ms).
Accuracy: ~80% on shared-prefix prediction tests, compared against actual vLLM cached_tokens from completed requests. The 20% miss rate comes primarily from:
vLLM’s prefix caching is a powerful optimization, but its lack of a preflight cache-hit prediction API makes cache-aware routing and latency estimation impossible. The probe-based approach - sending max_tokens=1 requests to measure cache state - is fundamentally broken because probes contaminate the cache they measure.
The solution is to observe, not measure: subscribe to vLLM’s ZMQ KV cache events, maintain a local hash-based index using FNV-64a over CBOR-encoded block keys (matching llm-d’s protocol), and expose a REST endpoint for pre-request prediction. This achieves ~7ms prediction latency, zero cache contamination, and ~80% accuracy.
The benchmarks reveal an important nuance: prefix caching’s benefit is concentrated in short-output workloads (RAG, classification, extraction) where prefill dominates. For long-output workloads, decode at ~40 tokens/sec dominates >99% of total latency, making prefix caching’s total-latency impact negligible - even though TTFT still improves.
For teams running self-hosted LLM inference with multiple vLLM replicas, a cache-preflight sidecar enables:
All without contaminating the cache, modifying vLLM, or sending a single inference probe.
Building this sidecar is only half the challenge. In production, you need it integrated into a broader inference infrastructure. Kaji, our autonomous AI agent, can manage this kind of sidecar deployment autonomously - monitoring cache hit rates, scaling sidecar instances alongside vLLM replicas, and flagging when cache-state drift suggests a restart or rebalance is needed. For teams routing across multiple model endpoints, the Shakudo AI Gateway can consume the sidecar’s preflight predictions to make token-cost-optimized routing decisions, directing requests to the replica with the best cache overlap before a single token is computed. Both run on the Shakudo Platform, which provides the governed deployment environment for AI and data workloads with built-in observability, RBAC, and infrastructure automation.
Yes. vLLM includes built-in prefix caching (also called automatic prefix caching or APC). When enabled via --enable-prefix-caching, vLLM hashes incoming prompt tokens into 16-token blocks and reuses cached KV tensors for any prefix that matches a previously processed request. This avoids recomputing the prefill phase for repeated or shared prompt prefixes, which can reduce time-to-first-token by up to 112x for fully cached prompts.
vLLM uses a paged attention scheme inspired by OS virtual memory. The KV cache is divided into fixed-size 16-token blocks. Each block stores the key and value tensors for its 16 tokens. When a prompt arrives, vLLM computes a content-addressed hash for each 16-token chunk, chaining each block hash to its parent. If a block hash already exists in the cache, vLLM reuses the stored KV tensors instead of recomputing them. Blocks are managed with an LRU eviction policy, and partial blocks (fewer than 16 tokens) are only cached once completed.
Not natively. vLLM does not expose any API, endpoint, or internal call to query cache state before submitting a request. The cache is write-on-read: you only discover a cache hit after the request is processed. This is the core problem our sidecar solves. By subscribing to vLLM’s ZMQ KV cache events (--kv-events-config), the sidecar maintains an independent hash-based index of cached blocks and exposes a POST /v1/cache/predict endpoint that predicts cache hits in ~7ms without sending any inference traffic to vLLM.
The block size is 16 tokens. vLLM partitions prompts into 16-token chunks, and each chunk is hashed and cached independently. This means cache hits are block-granular: a prompt can have partial cache hits where some 16-token blocks are cached and others are not. The 16-token granularity also means that two prompts sharing a 15-token prefix will not benefit from prefix caching for that shared prefix, since the partial block is not stored until it reaches 16 tokens.
With the ZMQ hash-based sidecar approach described in this post, cache hit prediction completes in approximately 7 milliseconds. This includes tokenizing the incoming prompt, computing FNV-64a block hashes over CBOR-encoded payloads, and looking up each block hash in the local map[BlockHash][]PodEntry index. By comparison, the probe-based approach (sending a max_tokens=1 request to vLLM) took approximately 47ms per probe - and critically, it contaminated the cache, making it unsuitable for production use.
Not significantly for total latency. Our benchmarks showed that for decode-heavy workloads (max_tokens=8192), prefix caching’s impact on total request latency was negligible (1.00x speedup). The reason is mathematical: at ~40 tokens/sec decode throughput on an A100 80GB, generating 8192 output tokens takes ~205 seconds, while prefill for a typical prompt takes under a second. Decode dominates >99% of total latency. Prefix caching eliminates the prefill cost, but prefill was already a tiny fraction of total time. Where prefix caching shines is short-output workloads (RAG, classification, extraction) where prefill is a meaningful percentage of total latency and time-to-first-token matters for user experience.